Bike Component Wear Dashboard
Work in Progress — It’s supposed to showcase with simulated data, but not currently rendering. Returning to refine in the next session.
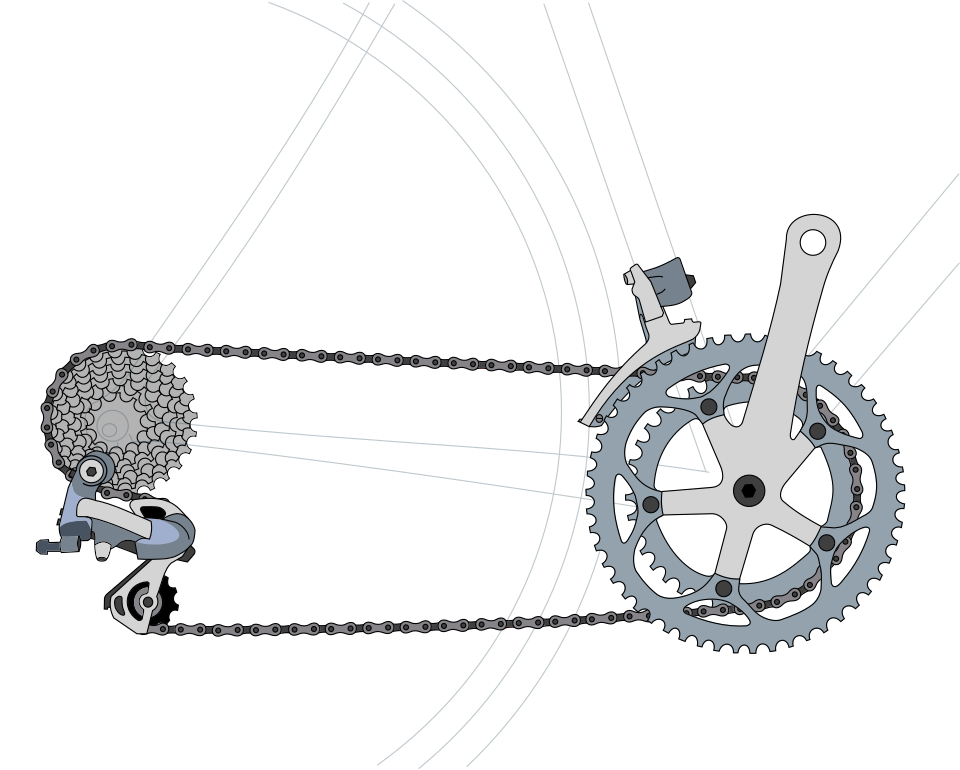
I’m an avid cyclist who tends to go deep on the details — and one thing I’ve always been curious about is how my components actually hold up over time. Not just mileage, but the real variables: how much climbing I’m doing, how hard I’m descending, and what the conditions are like — wet roads, mud, dry trails. All of it affects your drivetrain, your brakes, your cables differently, and I wanted to see that play out visually across a ride history.
This project is my attempt to combine that passion for cycling with my growing practice in AI-assisted development. I built it to track the natural wear and tear of bike components in a way that actually reflects how riding works in the real world — not just miles logged, but miles earned under different conditions.
Bike Component Wear Dashboard
Upload a ride log CSV to explore wear vs. usage and conditions.
Insights & recommendations
Ride timeline & maintenance
Chain wear vs. total miles
Chain wear vs. climbing (ft gain)
Brake pad wear vs. descending (ft loss)
Visual component health
Component condition overview
Wear heatmap by ride
Wear added per ride · green = low → red = high